Landed-home prices climb 2.9% in Q3 as HDB resale prices ease
Final Q3 2026 figures show houses outpacing apartments. For landed buyers, plot dimensions and rebuilding controls make the individual comparison more complicated.
Published 2026-10-24 · 6 min read
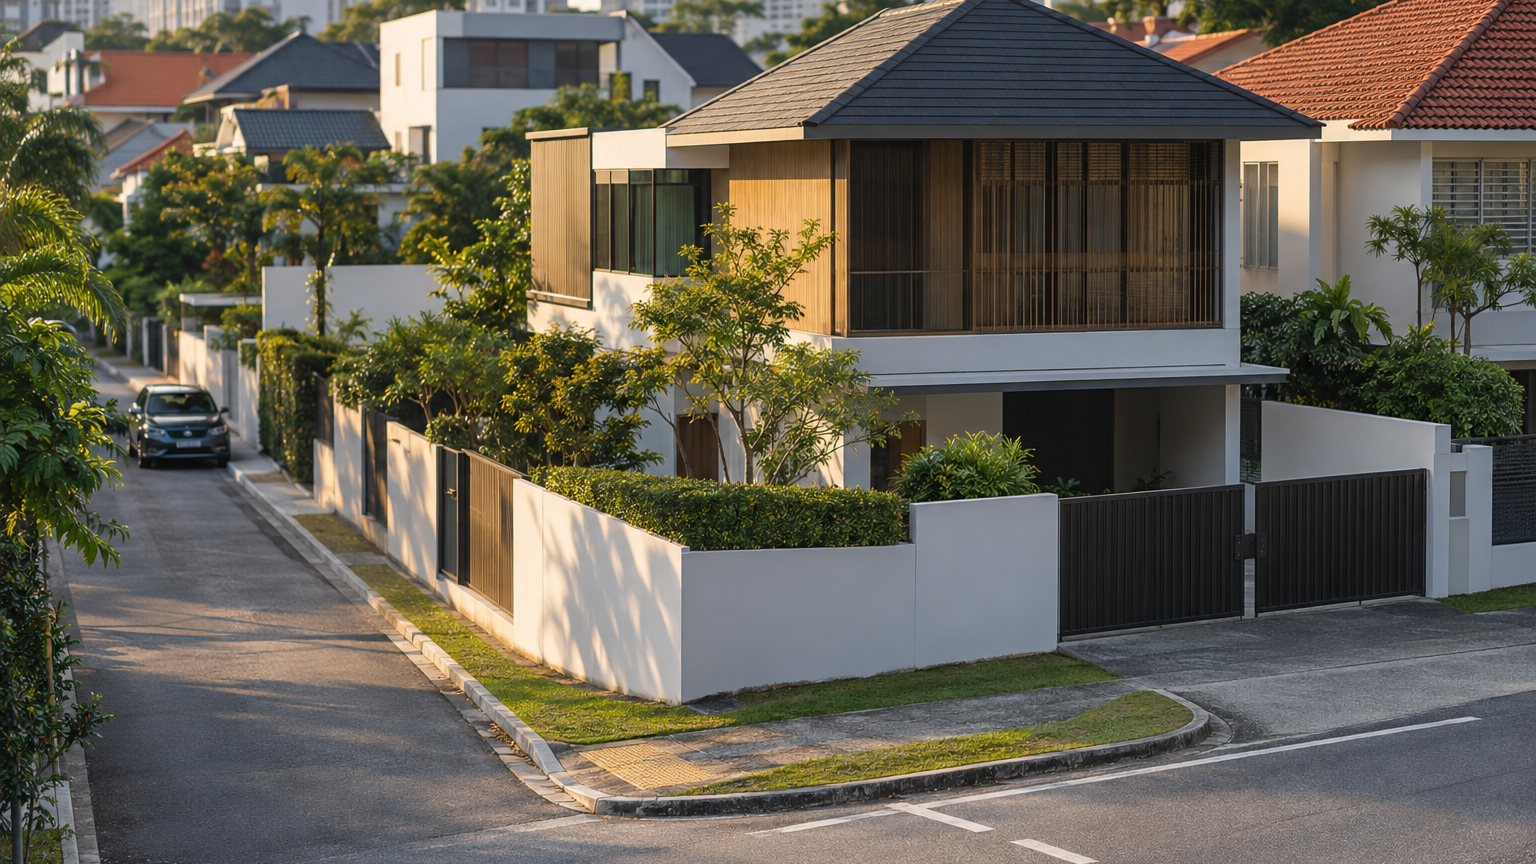
Landed-home prices rose 2.9% in the third quarter of 2026, outpacing the overall private housing market as HDB resale prices edged down. The final figures, released by the Urban Redevelopment Authority (URA) and Housing & Development Board (HDB) on 23 October 2026, show a widening contrast between the two markets.
For a household considering a move from a flat to a house, that contrast matters: the market they hope to buy into grew more expensive while the resale-flat index softened. But the landed figure also conceals the question that matters most when viewing an individual house—how much of its appeal lies in the existing building, and how much in the land and what can be built on it?
Landed homes pulled ahead of the wider private market
URA’s overall private residential price index increased 1.4% quarter on quarter, following a 0.5% rise in the second quarter. Within that total, landed prices rose 2.9%, compared with 1.0% for non-landed homes. Landed growth also accelerated from 2.5% in the preceding quarter.
The useful comparison is therefore not simply “private homes up, HDB down”. Landed prices grew 1.9 percentage points faster than non-landed prices during the quarter—a calculation from URA’s two segment figures. A household comparing a house with an apartment was looking at markets moving at noticeably different speeds.
These are the final quarterly figures, rather than the flash estimates released earlier in October. The landed increase was revised from 2.8% to 2.9%, while HDB’s decline was revised from 0.2% to 0.1%. The revisions were small, but they matter when identifying which release a quoted number belongs to.
An index measures movement across a market; it is not a fresh valuation of every property within it. URA’s landed index is an aggregate, quality-adjusted measure, so applying a blanket 2.9% uplift to an individual house would skip over differences between the properties being compared.
HDB prices eased, but more flats changed hands
HDB’s Resale Price Index ended the quarter at 202.5, down 0.1% from the second quarter. This was its third consecutive quarterly decline, following falls of 0.1% in the first quarter and 0.3% in the second.
Compounding those three published quarterly changes gives an approximately 0.5% decline over the first nine months of 2026. That is a calculation using rounded percentage changes, rather than a separately published HDB figure. It puts the sequence in perspective: three quarters of declines, but a modest cumulative movement.
Meanwhile, resale activity increased. HDB recorded 7,645 resale transactions, up 19.5% quarter on quarter. Prices and transaction numbers therefore moved in opposite directions: more flats changed hands even as the price index slipped slightly.
For someone selling a flat before buying a house, the two indices describe the broad backdrop, not the proceeds available for the next purchase. The relevant comparison remains the likely sale value of that particular flat against the price of the particular landed property—not the percentage gap between two national indices.
Higher prices did not come with a resale surge
The private market’s transaction figures add another useful distinction. URA recorded 3,801 private resale transactions, barely changed from 3,813 in the second quarter. Those totals cover private residential resales generally, rather than landed homes alone.
Developers launched 1,140 uncompleted private residential units and sold 1,183 during the quarter, excluding executive condominiums. These figures describe a different part of the market from an owner selling an existing landed house. They should not be treated as a count of competing houses available in a particular neighbourhood.
Taken together, the figures show why the stronger price reading should not be described simply as a rush of transactions. Private resale activity was broadly steady while the price index rose, and the landed segment recorded the faster increase.
The published aggregate result leaves a more local question unanswered: which neighbourhoods, tenures and types of landed property contributed most to that increase? Without that breakdown, the national result cannot settle whether an older leasehold terrace and a freehold detached house experienced comparable changes.
A bigger plot is not the same as a bigger rebuild
For a landed buyer, the distinction between land area and buildable space is especially important. URA’s planning controls address minimum plot sizes and widths, setbacks—the space that must be left between a building and its boundaries—and site coverage, or how much of the site a building may occupy. Requirements vary by landed housing type.
Height is also governed by the applicable building envelope and designated estate controls. The envelope is the permitted three-dimensional space within which the house must fit; it is not simply permission to reproduce a neighbouring house’s height or shape.
This makes frontage and plot shape practical considerations rather than details to leave until after purchase. Two plots with similar land areas can require different design responses once their dimensions, setbacks and applicable controls are considered. Land area alone is therefore an incomplete measure of rebuilding potential.
An older house may appeal because a buyer wants to retain and renovate it, or because the buyer wants a replacement home. Those are different propositions. A comparison that prices both only by land area risks overlooking the value of a usable existing building on one site and the planning work needed to establish a feasible replacement on the other.
Bring the comparison back to the house
A useful landed comparison starts with properties that are genuinely similar: tenure, house type, land area and location should be explicit before an asking price is judged against another sale. The planning comparison then asks a separate question—whether those sites offer similar scope for the home the buyer actually wants. URA’s index methodology and site-specific controls explain why these are different exercises.
Consider two hypothetical houses with similar-sized plots. One buyer wants a home to occupy largely as it stands; another wants to rebuild around a particular layout. Even if both buyers observe the same national price increase, they are valuing different things. The second buyer needs the proposed home tested against the site’s controls, rather than assuming the plot’s advertised size answers the question.
For an owner, the same distinction helps explain why a nearby asking price is only a starting point for discussion. An asking price expresses what a seller wants; it is not an achieved transaction, and a national quarterly increase does not bridge the gap between the two.
The clearest takeaway from the quarter is the divergence itself: landed prices rose faster than the wider private market while HDB resale prices eased. The unresolved question is how that broad movement translates to each street and site. For a family choosing a house, the next meaningful number is not another decimal point in the index—it is the price of a genuinely comparable property, with the land and rebuilding constraints understood.