Singapore landed prices climb 2.9% in Q3, ahead of the wider market
URA’s latest index shows landed pulling ahead. For a house purchase, the next comparison is tenure, land area and condition—not a blanket price uplift.
Published 2026-11-10 · 5 min read
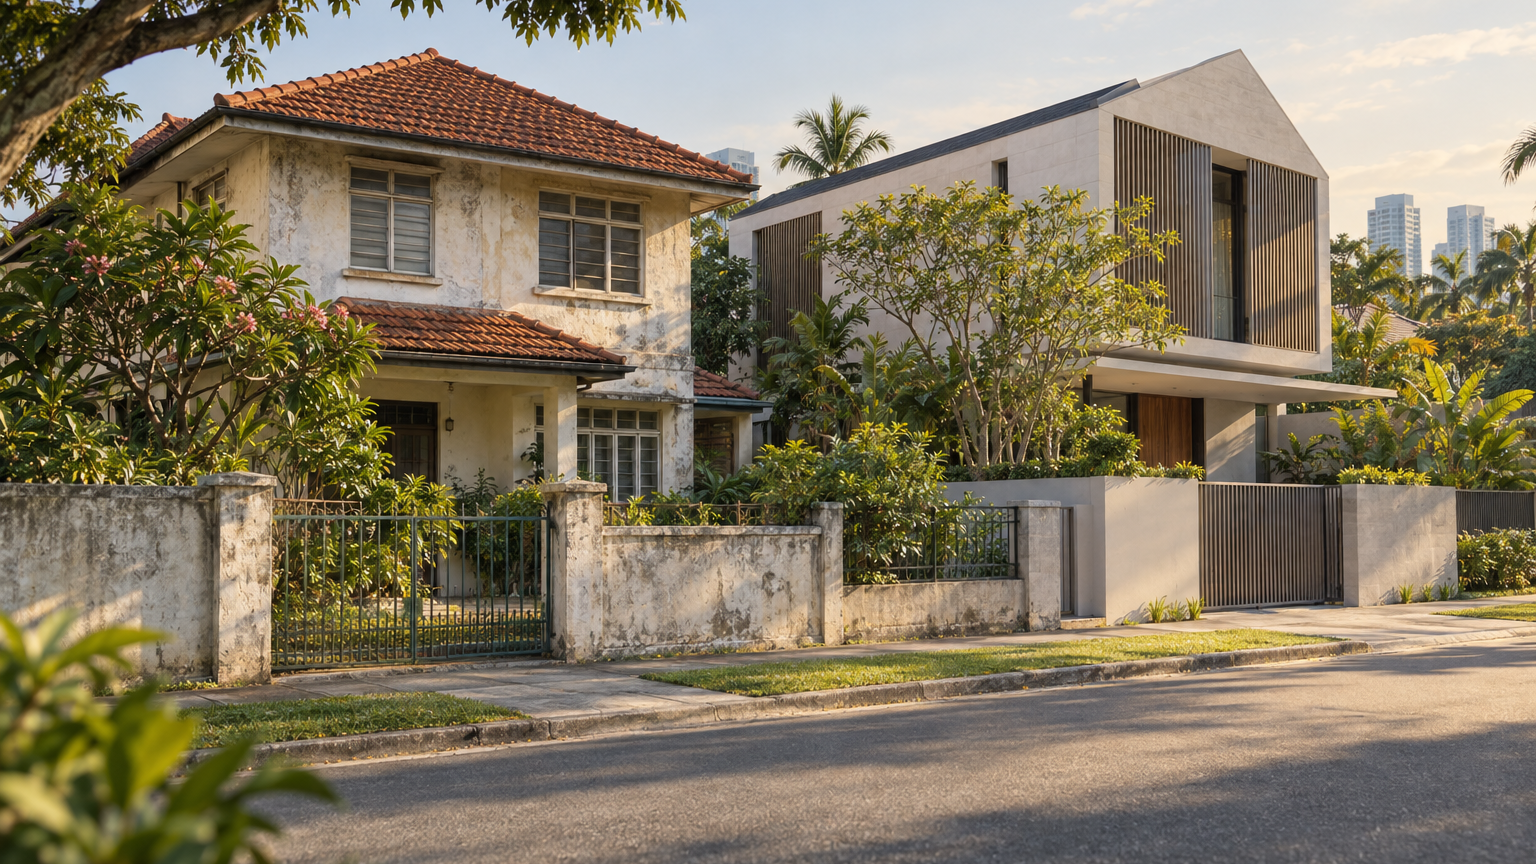
Singapore’s landed private-home price index rose 2.9% in the third quarter of 2026, comfortably ahead of the wider private residential market. URA’s figures, published in SingStat table M212261 and updated on 23 October 2026, show the landed index moving from 258.4 in the second quarter to 265.9 in the third.
For someone negotiating a landed purchase, the useful news is the difference in pace: non-landed prices increased about 1.0%, while the overall private residential index gained 1.4% over the same quarter. Those are market-level movements; applying the landed increase to a particular house requires a separate comparison of the property and its transaction evidence.
How far ahead did landed move?
The quarterly percentage change comes from dividing the increase by the previous quarter’s index level. For landed property, that is 7.5 index points divided by 258.4, multiplied by 100: 2.9%, rounded. The distinction matters because a 7.5-point index rise is not a 7.5% price increase.
Using the same calculation, non-landed property rose from 210.6 to 212.7, while the overall residential index moved from 219.4 to 222.5. On rounded growth rates, landed’s quarterly increase was 1.9 percentage points above non-landed and 1.5 percentage points above the overall market.
That makes the landed series the faster-moving of the two property categories in this quarter. But the overall residential figure includes landed property: it is a broader benchmark, not a separate competing segment. These concurrent movements also do not tell us how much landed contributed to the aggregate increase; that would require the relevant aggregation weights.
A stronger quarter, after an uneven climb
The latest increase followed another positive quarter. Landed’s index rose from 252.1 in the first quarter of 2026 to 258.4 in the second, equivalent to approximately 2.5%. Its third-quarter gain was therefore a little faster than the preceding quarter’s.
The path was not uniformly upwards, however. The landed index stood at 253.1 in the fourth quarter of 2025 before slipping to 252.1 in the first quarter of 2026. Looking only at the latest positive reading would miss that intervening decline.
Over the year from the third quarter of 2025 to the third quarter of 2026, the landed index increased from 244.8 to 265.9, or approximately 8.6%. That calculation describes the change in the national landed index over those four quarters—not the return achieved by an owner who bought and sold a particular house.
For a buyer comparing an older transaction with a current asking price, the chronology is useful context. The sensible next question is when that comparable sold, rather than treating every past transaction as if it belongs to the same market moment.
- Residential Properties
- Landed
- Non-Landed
Quarterly property-type indices, not district prices or individual-house valuations. The common base measures relative change, not differences in dollar prices. The series uses stratified hedonic regression and five-quarter fixed weights throughout this window.
What the index adjusts for
URA’s methodology has used stratified hedonic regression since the first quarter of 2015. In everyday language, this is a statistical approach that controls for differences in transacted properties, including attributes such as age and unit size, when estimating price movements. It is more considered than simply comparing the average price of whatever happened to sell each quarter.
Those estimated price movements are then combined using five-quarter fixed weights. The weights concern how movements are aggregated; the method should not be read as saying that the published quarterly change is a simple five-quarter average.
The underlying information comes from caveats lodged with the Singapore Land Authority, stamp-duty data from the Inland Revenue Authority of Singapore, and data supplied by developers. This is a statistical series assembled from transaction-related inputs, rather than a collection of sellers’ asking prices.
Its scope is equally important. Table M212261 provides national property-type indices with the first quarter of 2009 set to 100. It does not supply a neighbourhood breakdown or a valuation for an individual landed house. A higher landed index level than the non-landed level also does not express a dollar-price gap between the two categories.
Bring the comparison back to the house
For a live purchase decision, use the index to frame the timing question, then build the property comparison separately. Start with recent completed transactions in the relevant neighbourhood, and ask whether their tenure, land area and house condition make them useful matches. Keep the current seller’s asking price clearly separate from those achieved transaction prices.
Where rebuilding is part of the intended purchase, compare that proposition explicitly. A house being considered for continued occupation and a site being considered for rebuilding are different choices for the buyer. Establish what you are comparing before treating either as evidence for the price of the other.
These are proposed comparison criteria, not findings about which locations or house types drove the quarter’s increase. The retained table contains no individual transactions with which to make that assessment.
The practical conclusion is narrower—and more useful—than adding 2.9% to a previous house price. The national landed benchmark moved higher and outpaced the wider market in Q3 2026. Whether a particular asking price is justified still turns on the closest property-level evidence.