Singapore landed prices rise 2.9% as private developer sales fall sharply
URA’s Q3 2026 figures show resale activity barely changed. For landed buyers, plot dimensions and permitted rebuilding options make the comparison more useful.
Published 2026-10-25 · 6 min read
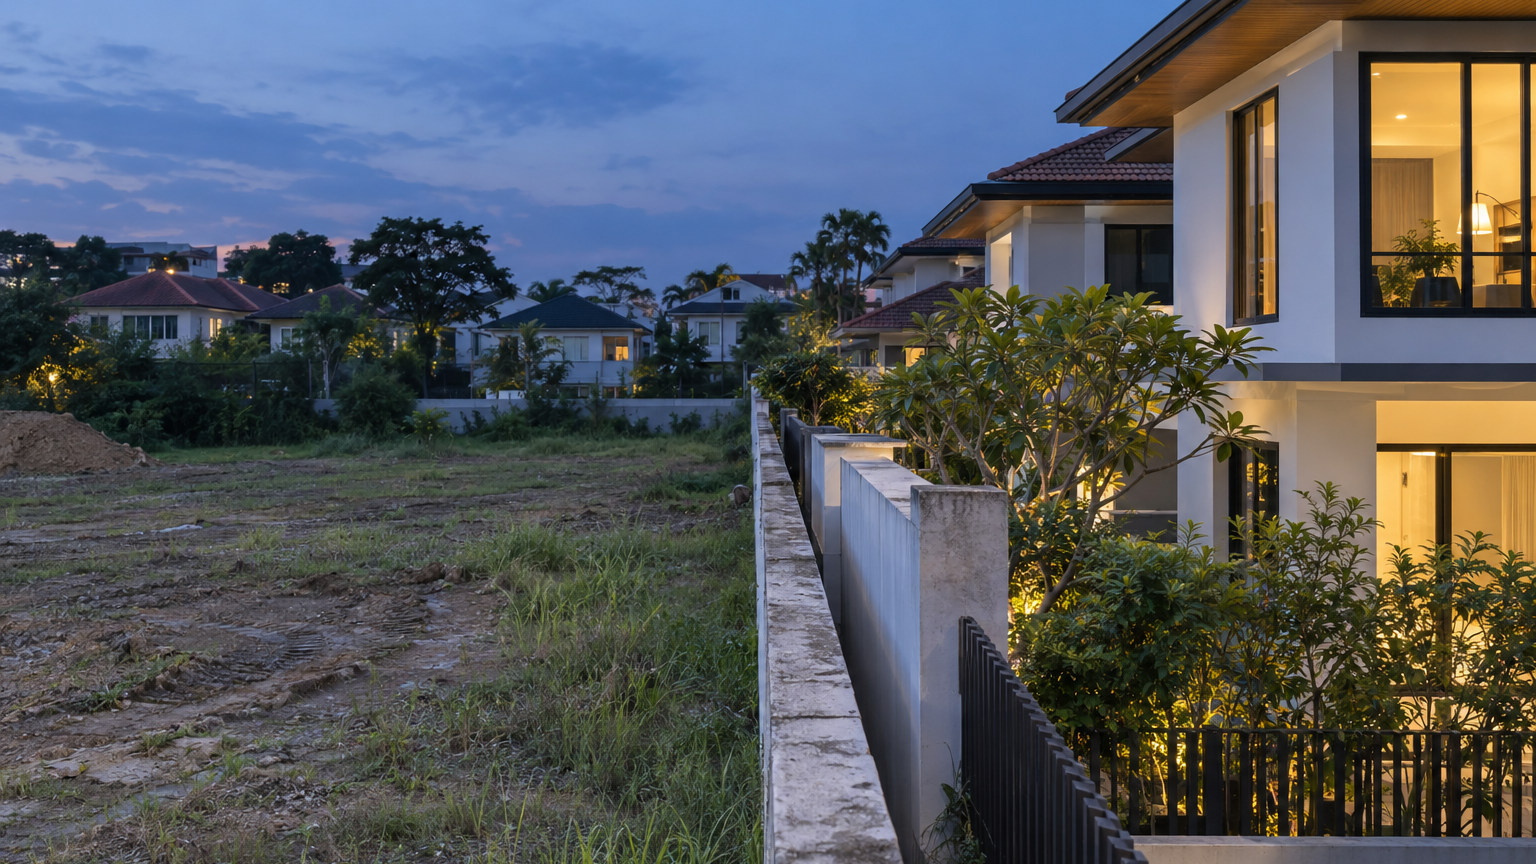
Singapore’s landed-home price index rose 2.9% in the third quarter of 2026, faster than the 2.5% increase in the previous quarter. The Urban Redevelopment Authority’s final figures, released on 23 October, put landed price growth well ahead of the 1.4% rise for private homes overall.
Yet the same release showed developers selling substantially fewer homes: 1,183 uncompleted private units, excluding executive condominiums, against 2,141 in the second quarter. For someone considering a landed house, the striking contrast deserves a closer look: prices accelerated, but the sharp sales slowdown was in developer sales across the private market—not a reported collapse in landed resale activity.
The useful question is therefore more specific than whether property is getting dearer. How much does this national movement tell you about the house you want—and how much depends on its land, tenure and permitted rebuilding options?
Where the sales slowdown actually happened
URA’s final figures separate two quite different developments. Developers’ sales of uncompleted private homes fell by 958 units, or 44.7%, between the second and third quarters. Resale transactions barely moved, slipping from 3,813 to 3,801—a decline of 12 transactions, or approximately 0.3%. These percentages are calculated from URA’s published counts.
Developers also launched fewer uncompleted private homes: 1,140 units excluding executive condominiums, compared with 1,783 in the previous quarter. That provides important context for the lower developer-sales figure, although these totals alone do not establish how much of the change came from launch availability or buyer demand.
The price figures also differed by property type. Non-landed prices increased 1.0%, while landed prices rose 2.9%. The landed increase was therefore 1.9 percentage points higher, calculated from the two published rates.
These are different sets of numbers answering different questions. The price indices describe price movements; the sales counts describe activity. In particular, the developer-sales total should not be read as the number of landed homes changing hands. URA’s figures support a sharper landed price increase alongside weaker developer sales, rather than a single explanation covering every part of the market.
What the 2.9% means for one house
The landed index is a broad reference point, not a valuation for an individual property. Its 2.9% quarterly increase does not attach the same uplift to every terrace house, semi-detached house or bungalow. The release reports an aggregate landed price movement, rather than street-by-street or house-by-house valuations.
For a buyer or owner, a more useful comparison starts with a question: what exactly am I comparing? A freehold house and a leasehold house should be identified separately in the comparison, with the remaining lease recorded where relevant. Land area, frontage, existing accommodation and the permitted housing form should likewise be made explicit rather than left inside a vague description such as “similar nearby house”.
This is a comparison method, not a claim that any one feature commands a fixed premium. If two houses differ materially, their sale prices need an explanation before either becomes a persuasive benchmark for the other.
The distinction matters particularly when an asking price includes an expectation of rebuilding. An asking price is the seller’s proposal; a completed transaction records what a buyer actually paid. Neither a national index nor a neighbouring owner’s asking price establishes what a particular site can accommodate.
Land area is only part of the rebuilding story
URA’s prevailing planning controls show why a large plot is not, by itself, a complete redevelopment proposition. They specify minimum plot sizes of 400 sq m for a detached house, 200 sq m for a semi-detached or corner terrace-I house, and 150 sq m for an intermediate terrace-I house. The controls also include width, setback and site-coverage requirements.
A setback is the required separation between a building and a boundary. Site coverage limits how much of the site the building can occupy. Together with plot width, these controls help determine the space within which a house may be designed; the minimum land-area figure is only one part of that assessment.
Consider a hypothetical comparison between two plots with the same stated area. Rather than assuming they offer identical rebuilding possibilities, a buyer would need to examine their dimensions against the applicable width and setback controls. The useful comparison is the resulting design opportunity, not simply the number of square metres on the listing. This is an illustration of how the controls operate, not a finding about any particular property.
For an owner deciding whether to sell the existing house or investigate rebuilding, that changes the first question. Before estimating the value of a future home, establish what could actually be permitted on the site.
A bigger plot does not automatically mean more houses
Another important distinction is between rebuilding one house and creating several. URA states that the permitted redevelopment form depends on the safeguarded housing type in the Designated Landed Housing Area plan. Redevelopment into more than one house requires planning permission.
In everyday terms, the planning designation helps determine what kind of landed housing is intended for the area. A proposal must be considered against that designation as well as the relevant physical controls. Meeting a minimum plot-size requirement is not, on its own, permission to subdivide or change the housing form.
That makes neighbourhood comparisons more precise. “Same neighbourhood” is a useful starting point, but a proposed comparison should also identify whether the properties have the same permitted housing form and comparable redevelopment constraints. Those details help distinguish a sale of an existing home from a sale whose appeal rests partly on a future building proposal.
The practical value lies in making the assumption visible. If a price is being justified by the possibility of two future houses, that possibility needs a planning basis—not merely enough apparent garden space.
The next useful number is property-specific
The quarter’s clearest landed-market finding is the acceleration from 2.5% to 2.9% price growth. Meanwhile, almost all the numerical decline across the reported developer-sales and resale categories came from developer sales: 958 fewer units, against just 12 fewer resale transactions. That comparison is calculated from URA’s final figures.
For an individual landed purchase, the next useful piece of work is narrower than another national forecast. It is a comparison of achieved transactions with the subject property’s tenure, land dimensions, existing house and permitted redevelopment form clearly identified.
For an owner weighing a rebuild, the unresolved question is equally concrete: what can this particular plot accommodate under the applicable controls? The national index describes the quarter’s movement. The planning assessment establishes which future version of the house is worth discussing.