Singapore landed rents rise 2.1% in Q3, outpacing non-landed homes
The latest URA index shows a stronger quarter for landed homes, but the annual comparison gives owners a more measured starting point for lease negotiations.
Published 2026-11-11 · 5 min read
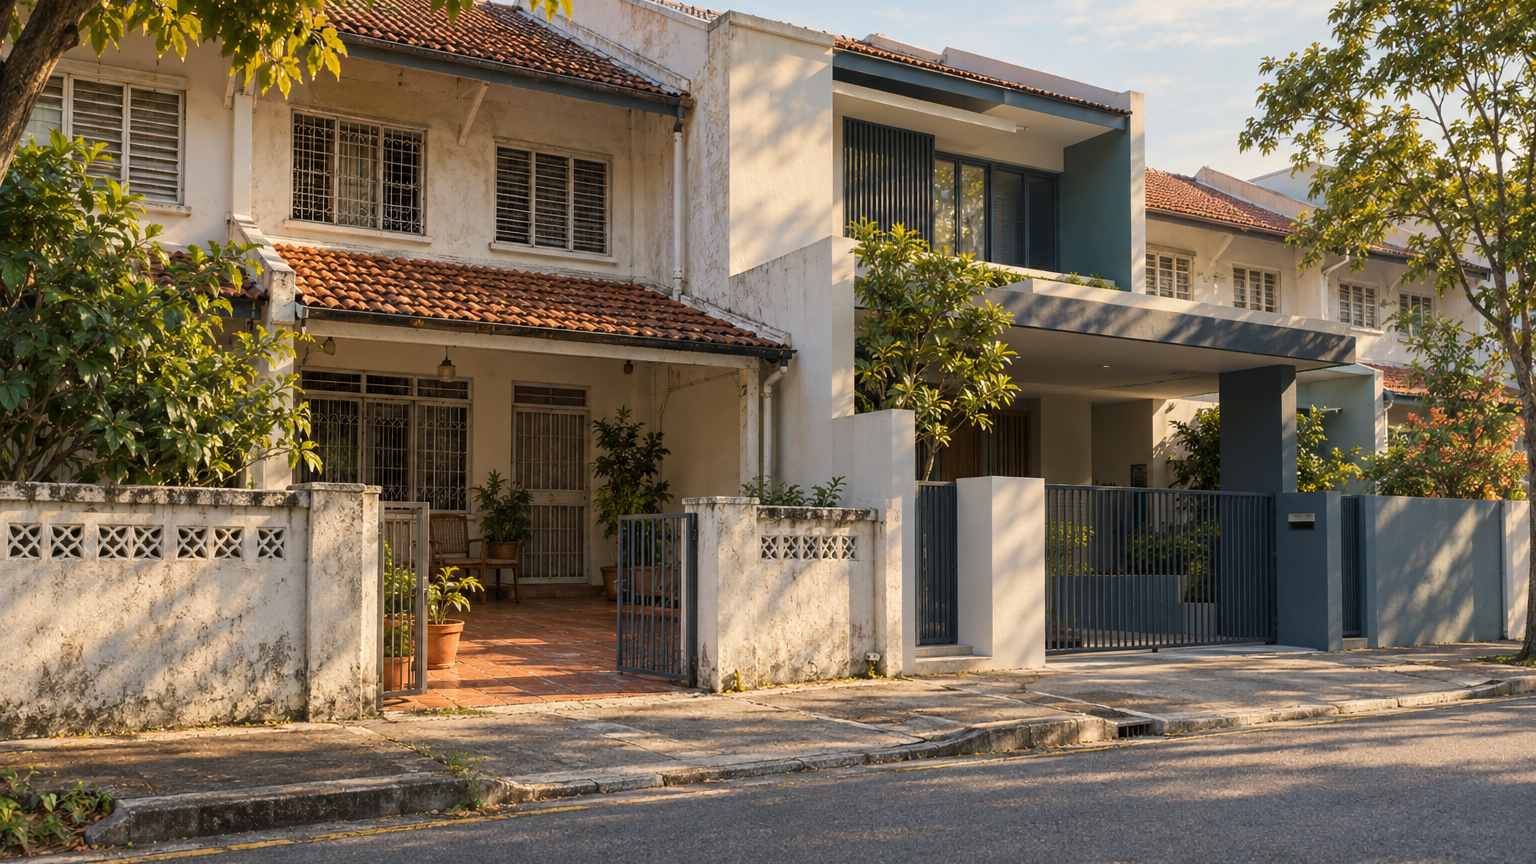
Singapore’s landed-home rental index rose 2.1% in the third quarter of 2026, faster than the 1.2% increase for non-landed homes. The landed index reached 159.7, up from 156.4 in the preceding quarter, according to URA’s rental series published through SingStat and updated on 23 October 2026.
For a landed owner preparing a lease renewal, that is useful evidence of the broader direction of rents. But the longer comparison adds an important detail: landed and non-landed rental indices were both about 1.9% higher than a year earlier. Landed’s stronger latest quarter is therefore a starting point for a pricing discussion, rather than a ready-made increase to apply to an individual tenancy.
What rose in the third quarter?
The overall private residential rental index increased from 162.5 in Q2 to 164.6 in Q3, a 1.3% quarter-on-quarter rise. Within that market, the landed index rose from 156.4 to 159.7, while the non-landed index increased from 162.5 to 164.5. All three series use the first quarter of 2009 as their base of 100.
The landed calculation is straightforward: divide the 3.3-index-point increase by the previous quarter’s 156.4, then multiply by 100. That produces 2.1% after rounding. The distinction matters: 3.3 index points is not a 3.3% rental increase.
Nor does the landed index’s lower numerical level mean landed homes are cheaper to rent than non-landed homes. These are indices measuring movement against a base period, not monthly rental amounts. The table provides no dollar rent with which to make that comparison.
For an owner, the useful headline is the pace of change within the landed series. Comparing index levels across property types answers a different question from comparing the rent a tenant would actually pay.
A stronger quarter, but a similar year-on-year rise
The recent path helps put the latest increase in perspective. The landed index stood at 156.8 in Q3 2025, fell to 152.1 in Q4, and then rose through 152.3 in Q1 2026 and 156.4 in Q2 before reaching 159.7 in Q3. The latest quarter followed a recovery from that lower year-end reading.
Over the full year from Q3 2025 to Q3 2026, the landed index rose approximately 1.9%. The non-landed index moved from 161.5 to 164.5 over the same period, also approximately 1.9%. Those percentages are calculated from the published index values and rounded to one decimal place.
That comparison changes how an owner might describe the evidence. “Landed rents rose faster this quarter” is supported; presenting the quarter’s gap as a sustained year-long lead would miss the similar annual growth. The relevant comparison depends on whether the discussion concerns the latest market movement or the change since an earlier lease benchmark.
- Landed
- Non-Landed
Quarterly Singapore property-type rental indices, not dollar rents or neighbourhood comparisons. The series control for selected property attributes and use five-quarter fixed weights; they cannot establish the rent achievable for an individual home.
How the index separates rent changes from property differences
Since Q1 2015, URA has used a stratified hedonic regression method for these rental indices. In everyday language, the statistical method controls for differences in property attributes, including age and unit size, rather than treating every rented property as interchangeable. The underlying rental data come from the Inland Revenue Authority of Singapore.
Rental movements are then combined using five-quarter fixed weights to produce the aggregate change. This is not simply a comparison of the average asking rent in advertisements, and the aggregate increase should not be reconstructed by taking a simple average of landed and non-landed percentage changes.
The adjustment makes the index useful for following broad rental movement. Its scope remains the key limitation for a lease negotiation: the supplied table separates landed and non-landed properties, but gives neither neighbourhood rental levels nor a rental assessment for a particular house. It is also not an asking-rent measure.
Turn the market reading into a local comparison
Before setting a new-lease or renewal proposal, obtain like-for-like local rental comparables. As a practical approach, ask for recent rental evidence for homes in the same immediate area, then compare house type, usable space, condition and lease timing. Keep advertised asking rents separate from rents actually agreed.
The aim should be to explain why each comparable belongs in the discussion. If a house differs materially from yours, identify that difference rather than treating its rent as a direct substitute. A short, well-matched comparison is more useful for this decision than a long list assembled only because every property is landed.
For a renewal, put the existing rent beside that local evidence before deciding on a proposal. For a new lease, use the same exercise to frame an asking rent and the room for negotiation. These are suggested decision steps, not rental levels established by the national table.
The Q3 release supplies a clear market backdrop: landed rents rose faster over the latest quarter, while their year-on-year increase was close to non-landed’s. The remaining question for an owner is more specific—and needs local evidence: what rent can this particular house support?