Terraces averaged less per home, but more per land square foot in 3Q2026
Huttons’ S$2.2 million average-price gap helps frame a landed search. Sales volumes, tenure and plot-size evidence explain why it is not a like-for-like saving.
Published 2026-10-27 · 7 min read
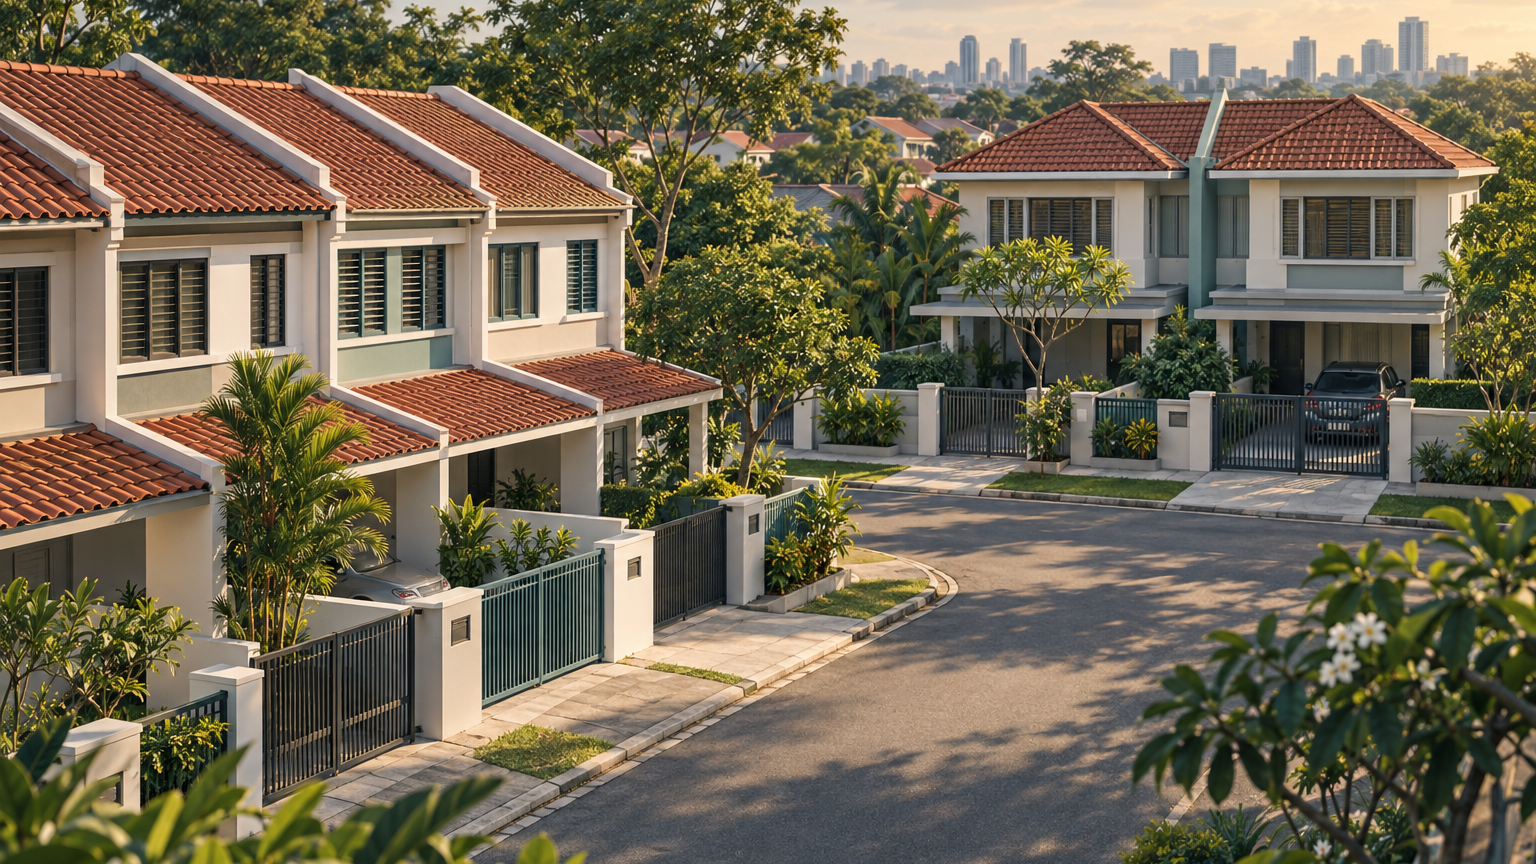
A terrace house averaged S$4.7 million in Singapore’s third quarter of 2026, against S$6.9 million for a semi-detached home, according to Huttons Data Analytics’ landed-market report. The S$2.2 million difference is substantial—but it compares two groups of properties sold, not the saving available on equivalent homes.
There is another useful twist for landed buyers: terraces had the lower average total transaction price, yet the higher average price per square foot of land. The reported figures were S$2,400 psf for terraces and S$2,082 psf for semi-detached homes. For a buyer deciding which type belongs in the same search, the total price and the land-price measure answer different questions.
The report’s data cutoff was 23 October 2026, and its coverage excludes Good Class Bungalows and strata/cluster houses. Those boundaries apply throughout this comparison; these are transaction statistics, not asking prices for homes currently available.
What the S$2.2 million gap actually buys you
Start with the straightforward arithmetic: S$6.9 million minus S$4.7 million equals S$2.2 million. That is the difference between the reported average transaction prices of semi-detached and terrace houses in 3Q2026. It is a useful indication of the different total purchase sums recorded in the two segments.
It is not a quotation for changing house type while keeping everything else the same. The segment averages are not a matched comparison holding tenure, neighbourhood, plot area and building condition constant. For a buyer, the useful interpretation is therefore a search-budget distinction, rather than a fixed discount attached to a terrace.
This changes how to use the figures. If your search is centred on terraces, the semi-detached average provides a broad reference for another segment—not a reason to increase your offer on a particular terrace. Equally, the gap is not a ready-made valuation deduction when comparing a semi-detached listing with a nearby terrace.
The question for an actual shortlist is narrower: what changes between these particular properties, and which changes matter to your household? Keeping the neighbourhood and tenure band similar would make that exercise more useful. The quarterly averages are the starting point for that comparison, not its answer.
Sales held steady for terraces, rather than surging
The transaction counts give the price comparison some necessary scale. Terraces recorded 300 sales in 3Q2026, against 301 in 2Q2026. Semi-detached homes recorded 143 sales, down 13.3% quarter on quarter. In other words, terrace activity held almost unchanged while semi-detached activity fell.
Across the report’s full landed sample, transactions declined from 516 to 487, a fall of 29 deals, or 5.6%. The broader quarter was quieter; the terrace segment stood out for maintaining its volume rather than posting a large increase.
Huttons interprets the pattern as some buyers being priced out of semi-detached homes and shifting towards terraces. That is the report’s explanation of the market, rather than a finding that tracks the same buyers from one intended purchase to another. The counts establish what sold; they do not isolate why each household chose it.
For someone considering both types, that distinction is practical. Stable terrace sales may help explain why the segment remained prominent in the quarter, but they do not tell you how much competition a particular listing will attract. Nor do fewer semi-detached transactions establish that sellers of the homes on your shortlist will accept a lower price.
Why total prices and land psf moved differently
The two segments also moved differently on average total transaction price. Semi-detached homes rose 4.2% quarter on quarter to S$6.9 million, while terraces fell 1.9% to S$4.7 million. On that measure, the average terrace purchase became smaller and the average semi-detached purchase became larger.
On the land-price measure, however, both rose. Semi-detached homes increased 4.7% to S$2,082 psf, while terraces increased 2.7% to S$2,400 psf. The terrace average was therefore S$318 more per square foot of land, calculated by subtracting the two reported figures.
There is no contradiction in a lower total price sitting alongside a higher land psf. One measure describes the whole transaction sum; the other expresses price relative to land area. Crucially, these are also averages across different sales, not two measurements of a single representative house.
For a buyer, lower total outlay and lower price per square foot are separate objectives. Someone working within a purchase ceiling may care most about the former. Someone comparing similarly located plots may pay closer attention to the latter, while still checking what building and condition come with each transaction.
Avoid dividing the segment’s average total price by its average land psf to manufacture an “average plot”. The supplied figures do not establish a matched property behind those averages. Use the actual land area of each shortlisted house for that calculation instead.
The smaller-plot finding belongs to the whole sample
Huttons reports that the average land size of transacted landed homes fell from 3,079 sq ft in 2Q2026 to 2,910 sq ft in 3Q2026. That is a reduction of 169 sq ft, or approximately 5.5%, calculated against the earlier quarter.
This is an overall landed-sample measure within the report’s exclusions. It is not a terrace-specific average, and it should not be used to claim that terrace plots sold in the quarter became 169 sq ft smaller. The statistic describes the changing mix of landed properties transacted across the sample.
It nevertheless helps frame a useful buyer question: is the lower purchase sum you are considering accompanied by less land? Answering that requires property-level figures. The report’s aggregate land-size change supplies context, not the dimensions of the terrace or semi-detached home you might buy.
For the same reason, neither the plot-size average nor the segment price gap should become an assumed rebuilding budget. If your intended purchase depends on substantial work, keep the acquisition comparison separate from a property-specific assessment of that work. This report is a market comparison, not evidence of a particular site’s rebuilding permissions or costs.
Make tenure and neighbourhood part of the comparison
House type was not the only dimension changing in the quarter. Huttons reports that 99-year leasehold homes accounted for 15.6% of landed transactions, up 2.4 percentage points from the previous quarter. That figure covers the broader landed sample, not terraces alone.
This makes tenure a relevant part of the comparison rather than a detail to leave until after comparing prices. A terrace-versus-semi-detached shortlist should identify which properties have 99-year tenure and which are freehold or 999-year leasehold before treating their prices as directly comparable. The report’s overall tenure mix cannot tell you how much of the S$2.2 million segment gap reflects that difference.
Location deserves the same treatment. Huttons identifies Districts 15, 16, 19, 20 and 28 as the main concentrations of landed purchases in the quarter. That describes where activity was concentrated; it does not supply a matched neighbourhood price adjustment for your chosen pair of houses.
For a more focused comparison, URA provides detailed private-residential data searches and a map covering transactions over the previous 60 months. Those tools offer a route to examining nearby sales, rather than relying solely on islandwide segment averages.
The useful next step is to compare actual homes within a similar neighbourhood and tenure band, then set their land areas, transaction dates and building conditions alongside the prices. That would help distinguish a cheaper purchase from a smaller or materially different purchase.
The quarter’s clearest takeaway is that terraces offered a lower average total transaction price, but not a lower average land psf. Whether that makes a terrace the better choice depends on the particular land and house available—not on treating S$2.2 million as money automatically saved.